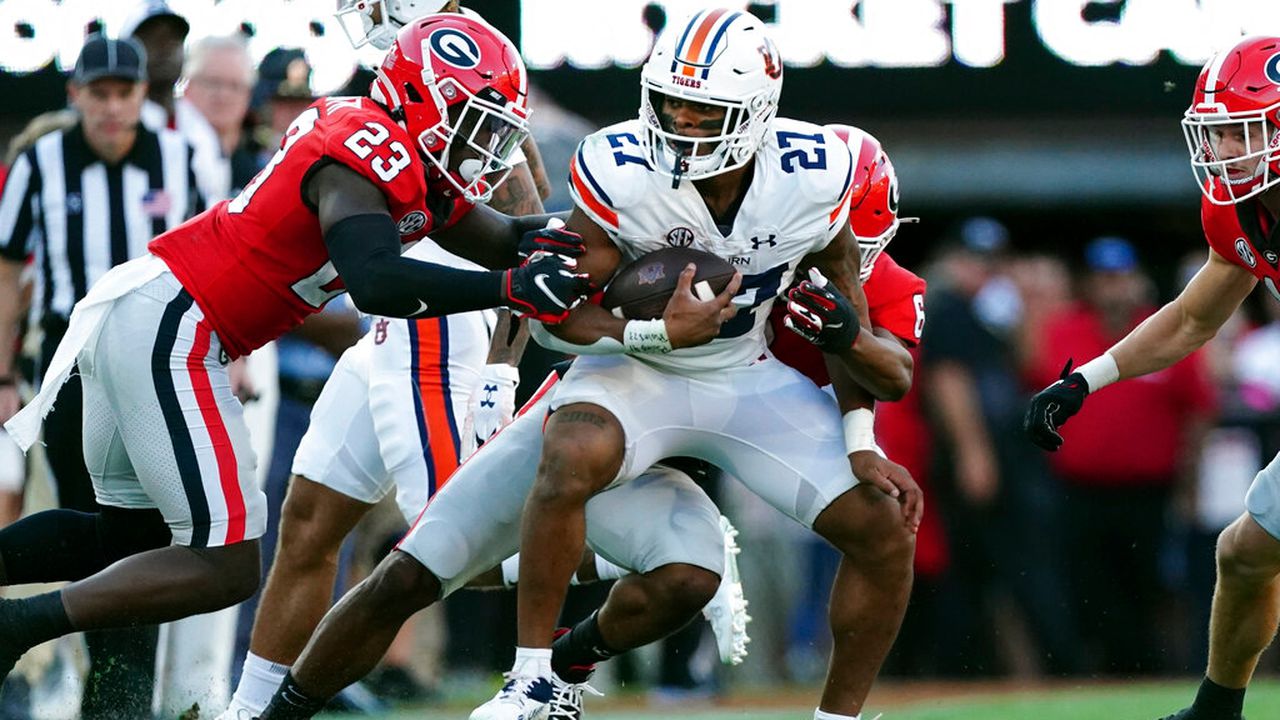
By the numbers: How Auburn footballâs stats compare to No. 1 Georgia, the rest of the nation
Through four games, we’ve learned a thing or two about the Auburn football team.
Perhaps the easiest conclusion to come to is that the Tigers aren’t half bad on defense, while the offensive side of the football is a different story. And that’s reflected when looking at the raw numbers.
Auburn’s defense ranks 25th in the country for total defense as it’s allowed an average of 298 yards per game. The Tigers’ defense also ties others in sixth place for red zone defense, allowing opponents to score just 55.6% of the time. And Auburn’s third-down defense still ranks near the top of the barrel as the Tigers hold the No. 14 spot, allowing opponents to convert just 28% of the time.
Offensively, however, some of the numbers are concerning.
As one might suspect, Auburn’s passing struggles are reflected by the numbers. The Tigers’ offense ranks 113th out of 133 FBS teams in passing offense, only averaging 173 passing yards per game. Meanwhile, after last week’s struggles moving the chains, Auburn’s third-down offense dropped to 83rd in the country as the Tigers have moved the sticks on third down just 39% of the time.
Now, as it relates to the top-ranked Bulldogs, if numbers are any indication, there are some weak spots.
In somewhat of a surprise, the Georgia offense ranks 65th in rushing offense, averaging just 159 yards per game — nearly 40 yards fewer than Auburn’s average. Though it is worth noting Georgia’s backfield has been a bit banged up early this season.
The red zone is another area the Tigers can look to capitalize is when Auburn’s offense gets into the red zone, where Georgia has allowed opponents to score more than 87% of the time. Granted, it’s worth noting the Bulldogs’ defense has been pinned on their heels inside the 20-yard line just eight times this season.
Here’s a complete look at the numbers, courtesy of cfbstats.com:
Rushing offense
1. Air Force – 340 yards/game
32. Auburn –197 yards/game
65. Georgia – 159 yards/game
Passing offense
1. Washington – 467 yards/game
11. Georgia – 337 yards/game
113. Auburn – 173 yards/game
Total offense
1. Washington – 593 yards/game
13. Georgia – 496 yards/game
84. Auburn – 371 yards/game
Scoring offense
1. USC – 55 points/game
14. Georgia – 41.5 points/game
52. Auburn – 32 points/game
Rushing defense
1. James Madison – 41 yards/game
18. Georgia – 87 yards/game
74. Auburn – 134 yards/game
Passing defense
1. Penn State – 138 yards/game
17. Auburn – 164 yards/game
41. Georgia – 195 yards/game
Total defense
1. Penn State – 219 yards/game
18. Georgia – 282 yards/game
25. Auburn – 298 yards/game
Scoring defense
1. Michigan – 5.8 points/game
10. Georgia – 11.3 points/game
23. Auburn – 16 points/game
Turnover margin
1. Penn State – +11
23. Georgia – +3
52. Auburn – +1
Interceptions
1. Liberty – 10
T-5. Georgia – 7
T-27. Auburn – 5
Fumbles recovered
1. East Carolina – 7
T-28. Auburn – 3
T-120. Georgia – 0
Penalties
1. Iowa – 20 yards/game
36. Georgia – 41 yards/game
T-66. Auburn – 51 yards/game
3rd down offense
1. Kansas – 60.4%
12. Georgia – 53.9%
T-83. Auburn – 39.2%
3rd down defense
1. Utah – 19.6%
10. Georgia – 26.3%
14. Auburn – 28.3%
Red zone scoring
1. Wisconsin – 100%
T-58. Georgia – 86.3%
T-85. Auburn – 80%
Red zone touchdowns
1. Toledo – 20
T-8. Georgia – 15
T-51. Auburn – 10
Opponents red zone scoring
1. Syracuse – 44.4%
T-6. Auburn – 55.6%
T-93. Georgia – 87.5%
Sacks
1. James Madison – 18
T-46. Auburn – 10
T-114. Georgia – 5
Sacks allowed
1. Iowa State – 1
T-19. Georgia – 4
T-111. Auburn – 12
Tackles for loss
1. USC – 41
T-75. Auburn – 22
T-75. Georgia – 22
Tackles for loss allowed
1. Michigan – 9
T-6. Georgia – 13
T-110. Auburn – 29
